
How can we project into the future and visualise the impact of rising sea levels around the world? This is the aim of the interactive simulation maps developed in France and the United States by a group of scientists, designed to forecast sea levels according to different global warming scenarios.

Do you live near the ocean, the Mediterranean or a major river?
Here are two interactive maps to help you estimate the rise in sea levels, based on a Google Maps or Openstreetmap* base map, according to the trend in global warming.
This simulator allows you to project yourself into the future by mapping the territories, according to several projections and situations.
So, depending on the scenario you choose, you can view different maps simulating the rising waters near you or elsewhere in the world.
Rising sea levels around the world
What is the impact of rising sea levels in France and around the world?
The consequences of climate change on sea levels, melting glaciers and the risk of localised flooding have been a growing reality for over 30 years.
Global warming and rising sea levels are a worrying reality that threatens our planet. The consequences of these phenomena are manifold, and their impact on coastal regions, islands and marine ecosystems is alarming. Given the urgency of the situation, it is vital that we take action to anticipate and combat these dangers and protect our environment.
- World water levels in figures:

To date and in the near future, the regions most affected by rising sea levels are South-East Asia (Bangladesh, Indonesia), the Pacific islands and certain coastal areas of North America (New York) and Europe (Netherlands).
According to estimates, around 200 million people could be displaced by the end of the century.
This situation would lead to unprecedented demographic and social upheaval.
- Cities and water levels around the world:

The causes of rising water levels
The main cause is climate change. Rising temperatures are melting glaciers and polar ice caps, contributing to rising sea levels.
Other causes of variations in levels include :
- thermal expansion of seas and oceans
- ocean circulation
- decrease or increase in salinity
- exchanges with land waters
It is therefore a global phenomenon, part of a complex system of interactions on a planetary scale.
- Simplified diagram of the process of sea level variations :

The consequences of rising sea levels
The consequences of this phenomenon are numerous, and particularly affect coastal and island areas. Marine submersion due to rising sea levels can cause flooding, accentuate coastal erosion and increase the loss of habitable areas.
It can also have a considerable economic impact on human activities such as tourism, agriculture and international trade.
Rising sea levels are also having an impact on marine ecosystems, notably by disrupting coastal habitats that are already heavily developed and destroying certain marine species.

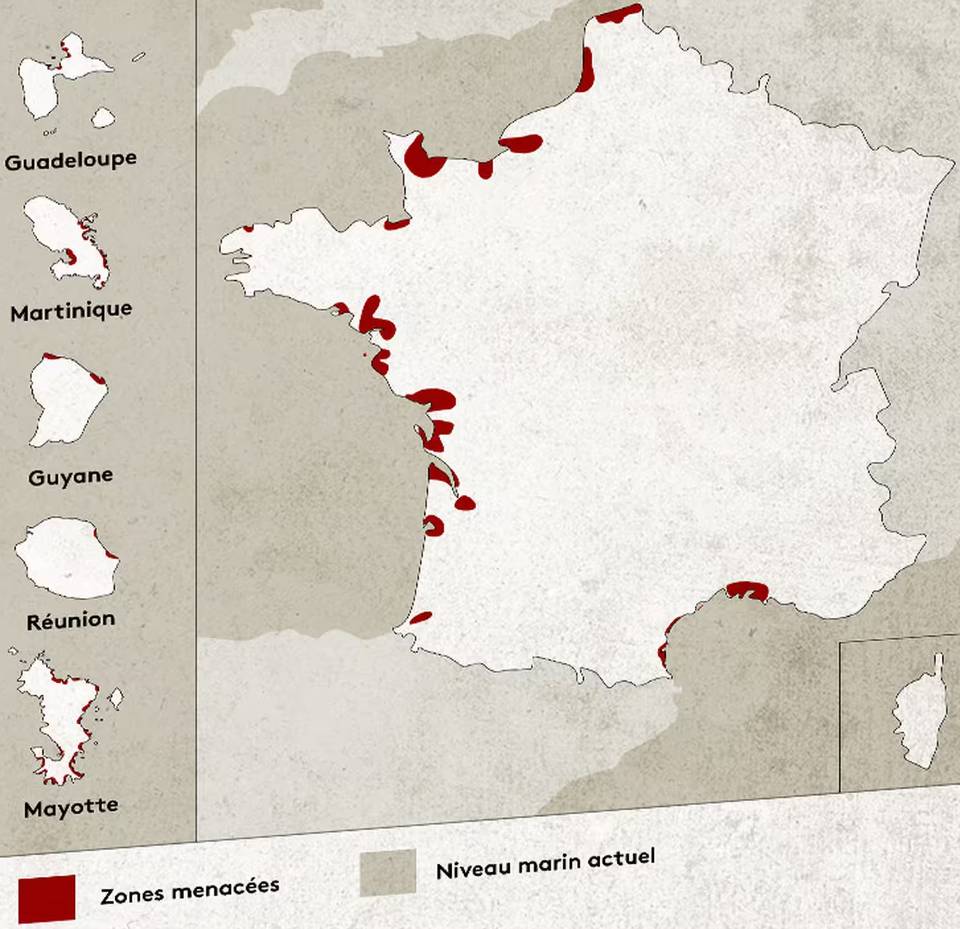
Rising waters in France
With 5,500 kilometres of coastline in mainland France and a further 14,500 kilometres in the French overseas territories, France is directly affected.
Nearly 1,000 municipalities, 700,000 hectares and 1.4 million inhabitants are directly threatened in the short term by erosion, submersion, regular flooding or salinisation of land and freshwater.
Storms and floods are becoming increasingly frequent, threatening the stability of coastal areas, marshes, beaches and, by extension, the safety of local residents.
Some areas of France are particularly vulnerable to rising sea levels. River mouths, marshlands and sandy coasts are the main areas already affected.
Between 20% and 25% of the coastline of mainland France is affected, with 270 kilometres retreating at a rate of more than 50 centimetres a year. For example, the rocky Basque coast is retreating by 25 centimetres a year and the sandy coast of Cap Ferret is losing 2 metres a year.
Ocean and climate* platform
Beyond the construction of dykes or dams to protect these at-risk areas, it is action against global warming, the restoration of coastal ecosystems and a change in land-use policy that will be decisive for the future.
Maps and simulations by region
For each map, you have a slider on the left of the map to choose the extent of the rise in water levels, as well as other factors and scenarios.
To find out more about the features and details of the maps, go to this page.
From north to south, east to west, here are the simulation maps for the main French coasts between seas and oceans, in mainland France and overseas:
Mediterranean coast
The Mediterranean, between Roussillon, Languedoc and the Côte d’Azur:

South Atlantic Ocean (France)
Nouvelle-Aquitaine region, from the Basque Country to the Pays-de-la-Loire :

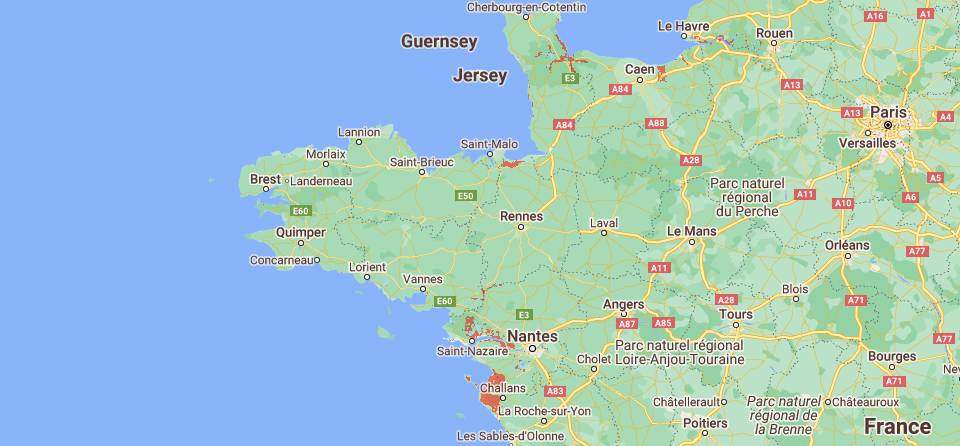
North Atlantic Ocean (France)
From the coast of Brittany to the Pays-de-la-Loire:
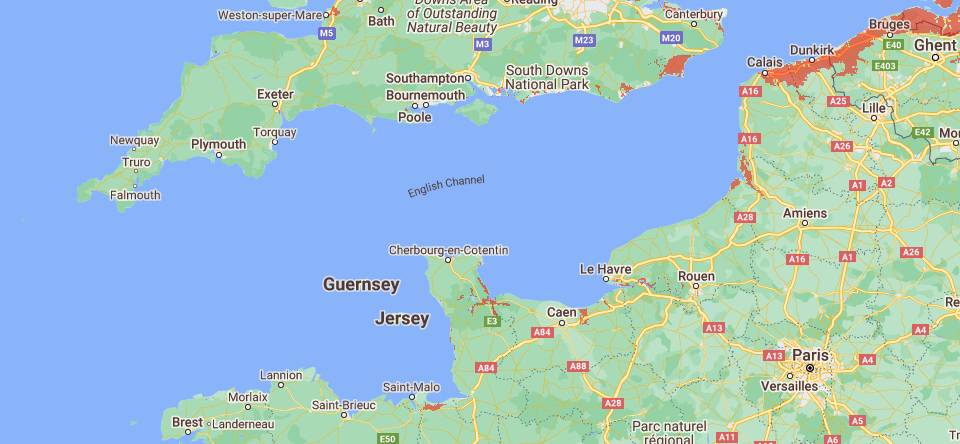
English Channel, North Sea
From the north of Brittany to the Belgian border:
Overseas
Atlantic, Pacific, Indian Oceans and Caribbean Sea:

Simulating rising sea levels around the world
And for a global view, you can also consult Climate Central‘s global map, the map of global scenarios according to scientific projections (IPCC, SROCC…) or according to your own scenario:

Rising sea levels are one of the consequences of global warming, via two main processes: the expansion of water and the melting of land ice.
Find out more?
To complete your map research on the future of the planet near you, you can also consult the interactive map of global warming by region.
Travel+
- Adapt or fight? Ocean & Climate ↗ (French)
- Impacts of climate change: Coastline and marine environment (French)
- Interactive map of rising sea levels
- Map of global warming by region
- Forest weather and fire risk in France (French)
- Going back in time with photos and maps, IGN (French)
- Vigicrues, risks and flooding (French)
- Environment, pages and articles
- Canals and waterways in France and towards Europe
- Watersheds in France and Europe (French)
- Flooding in France (French)
- Along the Rhône river