What tools can be used to simulate rising sea levels around the world, and how can we assess the impact of risingtemperatures on coasts in the years ahead? Interactive maps of the oceans, seas, lakes and rivers around the world and in France provide the answer.
As a direct consequence of global warming, rising sea levels are a worrying reality that threatens many of the world’s inhabitants. The consequences of this phenomenon on coastal regions, islands, marine ecosystems and people are considerable.
A daily reality that is confirmed year after year, rising sea levels spare no coastline and affect all low-lying areas, including along rivers. The direct cause of this phenomenon is the rise in global temperatures, which is causing the ice caps and glaciers to melt.
Map of major cities threatened by rising sea levels around the world:
On this page you will find a series of maps to help you simulate the rise in water levels over the next few years. Depending on the department, town, village or area along the French coast, along rivers and according to temperature variations, the choice is yours.
And to make it easier to visualise, we have selected two interactive maps to simulate the rise on different coastal territories from two different organisations:
BRGM, Bureau de Recherches Géologiques et Minières, the national geological survey (France)
Climate Central, an independent group of scientists based in Princeton (USA)
For each map, you can select certain options, the type of mapping and modulate the main factors used to simulate rising water levels, such as temperature.
Maps, instructions for use
For all the maps, we recommend that you run your simulations on a computer or project them onto a large screen for better visibility and, of course, a good internet connection for fast display.
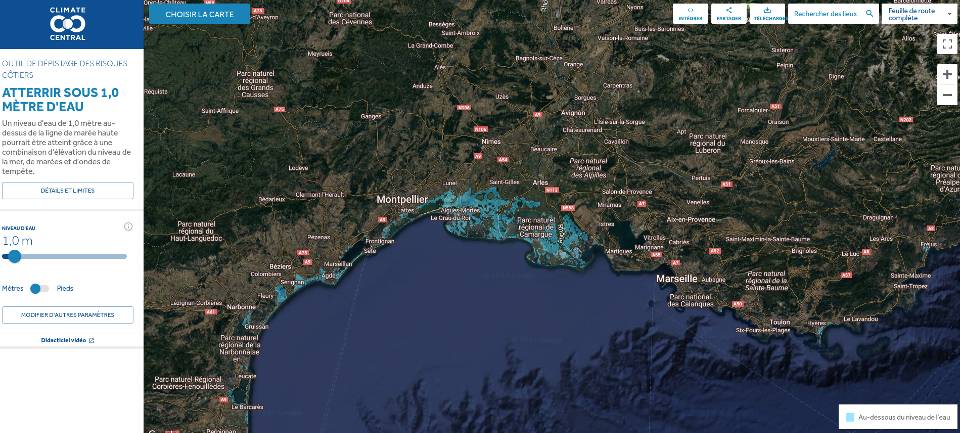
Climate Central map
The first map on offer is from Climate Central. Although it’s in English, it’s easy to translate automatically from your browser, and has a number of features, including :
Choosing map scenarios and displaying risk zones (choose map)
By melting of ice sheets and glaciers (ice sheets)
By new data (elevation dataset)
Other options, such as the impact on homes, marshes, wetlands or the risk of toxic tides, are only available for California or the United States.
To select your map scenario, go to the “Choose Map” drop-down menu at the top left.
Once you have chosen your scenario, the map, legend and tools in the left-hand column change automatically to display the new version of your map.
Screenshot: the full version of the Climate Central map
Another feature is at the top right, in the “Full road map“ tab. This is where you can choose the type of map to display your simulation: Full map, base map, cities only, satellite view, bare map, all with or without relief.
Finally, a search engine lets you search by country, location or address.
Screenshot: satellite version of the Climate Central map
A video tutorial is also available below:
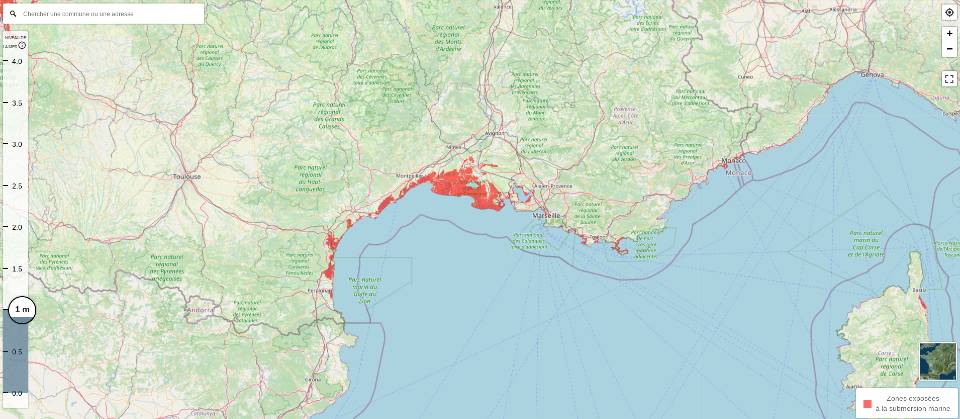
BRGM map
Simpler and quicker, the map simulating rising sea levels published by BRGM is entitled Zones exposed to rising sea levels at high tide.
In addition to sharing the link with social networks, downloading and a comprehensive information module in the top right-hand corner, this map also features :
Search by municipality or address (top left)
Selecting the water level (sea level, left)
Zoom or full screen (top right)
Choosing between a full or satellite map
The map base used by BRGM is Openstreetmap* and aerial imagery from the French National Geographic Institute (IGN).
For each territory, we offer you two maps for a more complete vision and a French and American geographical approach.
Maps of rising sea levels around the world
Here is our selection of maps to simulate rising sea levels in the country or region of your choice.
Rising water levels in France
From the Mediterranean to the North Sea via the Atlantic coast, here are the interactive maps of rising water levels in France for the coastal regions with :
The Mediterranean, between Italy and Spain, the Alps and the Pyrenees
Atlantic, from Brittany to the Basque country
English Channel and North Sea, from Normandy to the Opal Coast
The Atlantic, Pacific, Indian Oceans and the Caribbean Sea overseas
Would you like a better understanding of the changes underway? Here’s a clear explanation of the causal links between global warming and rising sea levels. Extract from the BRGM* website:
The rise in sea levels observed since the end of the 19th century is a consequence of climate change caused by greenhouse gas emissions. As the climate warms, it is causing thermal expansion of the oceans and the melting of mountain glaciers.
In addition, the melting of the ice caps has accelerated since the early 2000s. Other phenomena such as the extraction of groundwater, the construction of dams, the deformation of solid earth, variations in salinity and ocean circulation have global or regional effects which, while not negligible, are often of a lesser order of magnitude.
Over the course of the 21st century , sea levels will continue to rise: rates of change could be stabilised if policies to reduce greenhouse gas emissions are successful.
Observations and projections of global sea level rise / IPCC , BRGM, Dangendorf 2019
On the other hand, it will accelerate if the 2°C threshold mentioned in the Paris Agreement is exceeded, the more rapidly greenhouse gas emissions rise. The statistical scenarios above indicate a likely range up to 2100, but do not rule out higher values. Scenarios exceeding one metre by 2100 assume a contribution from the Antarctic or Greenland ice caps. It is not possible today to rule out such scenarios, whatever the climate change scenarios considered.
Sea levels will not rise uniformly: on the contrary, they will show strong regional variability due to inhomogeneous warming of the ocean and deformations of the solid Earth, the gravity field and the Earth’s orbital parameters.
Sea level variation processes / BRGM, Cazenave and Le Cozannet, 2014
Global simulation
In addition to the local maps, a global simulator of regional changes in sea level allows you to visualise different scenarios of contributions to global sea-level rise.
Regional simulations
As a reminder, here is the list of regional simulation maps: